Open-data capability demonstration: Water & Environment
Wastewater Effluent Data Quality
Continuous effluent monitoring is only as useful as the data is trustworthy. This is a worked, fully open demonstration of how we make it trustworthy: statistics to find the anomalies, and declarative rules to encode the physics so impossible records can never pass.
Data analysed
1,382
days of full-scale works data
Physical invariant
100%
of rows pass COD ≥ BOD
Validation rules
8
SHACL shapes (R1–R8)
The Challenge
The UK is rolling out continuous water-quality monitoring on wastewater assets under the Environment Act 2021, and the Environment Agency is exploring whether that data can serve as a regulatory tool and a transparent record for the public. The hard question underneath is data quality: calibration drift, fouled probes, telemetry gaps and transcription errors all masquerade as real water-quality signals. Before continuous monitoring can carry regulatory weight, someone has to be able to say, defensibly, which readings are trustworthy.
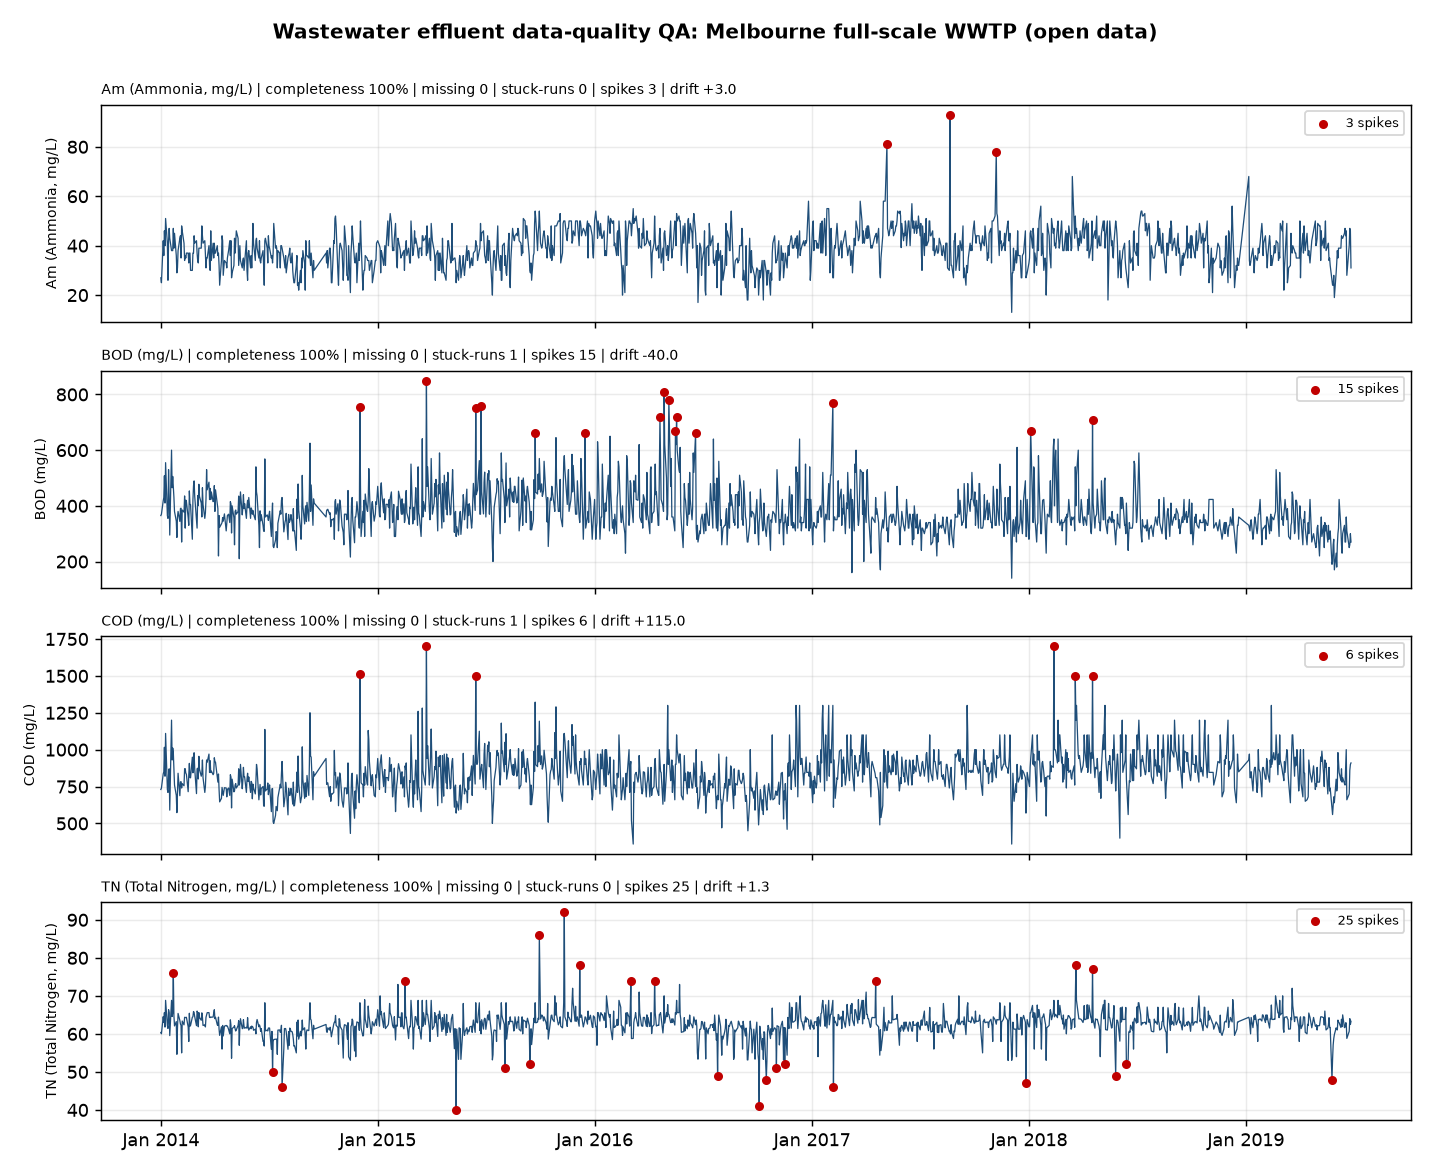
To demonstrate our method on real, open data, we analysed a full-scale wastewater treatment works dataset of 1,382 daily records carrying the regulated effluent suite (ammonia, BOD, COD, total nitrogen, plus inflow and outflow). Source: a public dataset released under CC BY-SA 4.0.
The quality-assurance battery
Two layers work together. Statistics finds the anomalies; a declarative ontology and SHACL rule set of eight shapes (R1–R8: date, four determinand ranges, non-empty record, the COD ≥ BOD invariant and a flow-conservation check) encodes the domain physics that decides which anomalies are merely unusual and which are impossible. The six check families below are reproducible and open source.
| # | Check | What it catches |
|---|---|---|
| 1 | Completeness against cadence | Detects telemetry dropouts and maintenance gaps where a monitor reports less often than its design interval. |
| 2 | Stuck-sensor / flatline detection | Flags runs of invariant values, the signature of a frozen or fouled probe reporting a constant. |
| 3 | Robust outlier detection (MAD) | Median-absolute-deviation spikes, so genuine pollution events are not masked by their own influence on a mean-based threshold. |
| 4 | Physical-range plausibility | Per-determinand non-negative bands (ammonia, BOD, COD, total nitrogen) that reject impossible readings. |
| 5 | COD >= BOD cross-parameter invariant | Chemical Oxygen Demand can never be below Biochemical Oxygen Demand. A record where it is, is physically impossible and is rejected, something no single-column check can see. |
| 6 | Baseline drift estimation | Quantifies slow shifts between service visits, the calibration-and-fouling drift that single-point range checks miss. |
Outcome
The analysis is complete and internally consistent: the COD ≥ BOD invariant holds on every one of 1,382 rows, a strong curation signal. But the quality-assurance pass still surfaces genuine structure a trend analyst must handle, including a multi-year COD baseline drift and dozens of statistical outliers per determinand. The declarative SHACL rules catch every planted physically-impossible record and pass every clean one, with a named reason for each rejection. The verdict on whether the data can be trusted is therefore auditable, which is exactly what a regulator needs.
The full ontology, the SHACL data-quality shapes, the statistical analysis and the worked examples are published open source as a case study in Open Ontologies, our open data-validation platform.
"Classification of whether data can be trusted should be declarative, not learned. Statistics finds the anomalies; the ontology encodes the physics, such as the simple fact that chemical oxygen demand can never fall below biochemical oxygen demand, that decides which anomalies are impossible. That separation is what makes data quality auditable."
Tesseract Academy
Explore the open-source case study
Ontology, SHACL rules and analysis on GitHub. Data under CC BY-SA 4.0.